Your server keeps a page table — a structure in RAM whose only job is to describe where other memory lives. Every process has its own, with one 8-byte entry per 4 KB page it has actually touched. In PostgreSQL every connection gets its own backend, and every backend is a separate OS process — so each one keeps a private description of the same shared_buffers. The more memory you give the database and the more connections you run, the more RAM disappears into simply describing memory you already own. On a typical production box — 32 GB shared_buffers, 600 backends — that routinely lands in the 10–20 GB range: RAM wasted describing RAM.
Table of Contents
- The problem, in numbers
- Measure your own server
- How it works under the hood
- PostgreSQL configuration
- Aside: a pooler may be enough
- Conclusion
- Notes
1. The problem, in numbers
The arithmetic is short. Linux hands out memory in 4 KB pages by default, and the kernel needs one 8-byte entry to describe each page a process has touched:
shared_buffers ÷ 4 KB × 8 bytes = page table, per backend
For a 32 GB shared_buffers that is ~8.4 million entries (8,388,608 exactly), or 64 MB per backend. Nothing shares it — page tables are per-process, so the total can scale linearly with your connection count.1
That gives the ceiling — what it costs if every backend has read all of shared_buffers:
| Backends | 32 GB shared_buffers |
64 GB shared_buffers |
|---|---|---|
| 10 | 0.62 GB | 1.25 GB |
| 100 | 6.25 GB | 12.50 GB |
| 300 | 18.75 GB | 37.50 GB |
| 600 | 37.50 GB | 75.00 GB |
With 2 MB huge pages the same 32 GB needs 16,384 entries — roughly 128 KB per backend, 512× less.
🧠 A real case from production. With
shared_buffers = 32GBand 600 backends, total page-table memory landed at ~18 GB — about 31 MB per backend, half the 64 MB ceiling, because no backend had touched all ofshared_buffers. With 2 MB pages the same fleet needed 75 MB total.CPU usage dropped by roughly 4–10% on top of that. Note what that number does not contain — the freed memory was handed to nobody (no OS page cache in play either — that server stored its data on ZFS, so caching happened in the ARC). It simply sat unused. Several gigabytes of RAM came back, and spending them — a larger
shared_buffers, more room for the ZFS ARC — should push the gain further still. The 4–10% is what you get before that.
2. Measure your own server
Before changing anything, find out what this is actually costing you:
# 1. Page-table memory across the whole system
grep '^PageTables' /proc/meminfo
# 2. Just PostgreSQL — total, and the average per process
awk '/VmPTE/ {t += $2; n++} END {if (n) printf "processes: %d\ntotal:     %.1f MB\nper proc:  %.1f MB\n", n, t/1024, t/n/1024}' \
    $(pgrep -x postgres | sed 's|.*|/proc/&/status|')
That is a real server: 18.2 GB of RAM spent on page tables, across 602 postgres processes, at 31 MB each.
PageTables in /proc/meminfo is the system-wide figure; VmPTE in /proc/<pid>/status is per process. The two should very nearly agree on a database host, and here they do — 18.3 GB system-wide against 18.2 GB from PostgreSQL alone, leaving about 100 MB for everything else on the box. If your numbers diverge by much more than that, something other than PostgreSQL is using the memory and is worth finding first.
Then decide:
- A few hundred MB — huge pages are not your problem. Spend the effort elsewhere.
- Several GB — you are paying a permanent memory tax to describe memory you already own, and a migration is worth working through. That RAM comes back to the page cache and the rest of the system, which helps whatever your workload looks like — an I/O-bound server may be I/O-bound precisely because those gigabytes went into page tables instead of caching data.
3. How it works under the hood
The mechanics — virtual addressing, the TLB, why a fault happens on memory that is already resident, and what a 2 MB page changes — are covered in a separate interactive explainer:
→ Why PostgreSQL spends gigabytes on page tables
It walks through the address translation path, the per-process page table problem, and the first-touch fault step by step, with an explorer where you can put in your own shared_buffers and backend count.
The short version, if you only want the conclusions:
- Every memory access needs a virtual→physical translation. The CPU caches recent ones in the TLB — roughly 2000 entries — and every miss costs a four-level walk through the page table in RAM. How much memory those entries cover is what changes:
- With 4 KB pages — 2000 × 4 KB = 8 MB. A 32 GB
shared_buffersoverruns that constantly, so misses are the normal case. - With 2 MB pages — 2000 × 2 MB = 4 GB. Still not the whole pool, and misses do not disappear — but they happen far less often than with 4 KB pages.
- With 4 KB pages — 2000 × 4 KB = 8 MB. A 32 GB
- Every connection gets its own backend, and every backend is a separate OS process — not a thread. So each one carries a private page table. Backend B faults on a page backend A already faulted in, because B’s own table is empty there. In practice, warm-up is not shared.
- The faults are minor — no disk I/O, just a brief switch into the kernel to fill in the missing entry. That is why the cost hides so well: no I/O wait to point at, no slow query to blame.
That is also where the 4–10% of CPU from the case above came from: nothing but address translation. The TLB started covering a useful share of the working set instead of missing constantly.
The worst case: an empty shared_buffers
The effect is biggest while shared_buffers is still empty and filling up, because then every access is a first touch. A change in Linux 7.0 showed this clearly in 2026: on a server with a very large shared_buffers and huge pages off, PostgreSQL became about two times slower. The fuel was first-touch faults on an empty pool; a scheduler change made it possible to preempt a backend in the middle of one while it held a buffer-allocation spinlock, and every other backend spun waiting for it. Huge pages removed the faults, and the regression went away.
4. PostgreSQL configuration
huge_pages
The huge_pages setting takes three values:
| Value | Behaviour |
|---|---|
try |
Use huge pages if possible, silently fall back to 4 KB otherwise (default) |
on |
Require huge pages; refuse to start if unavailable |
off |
Never use huge pages |
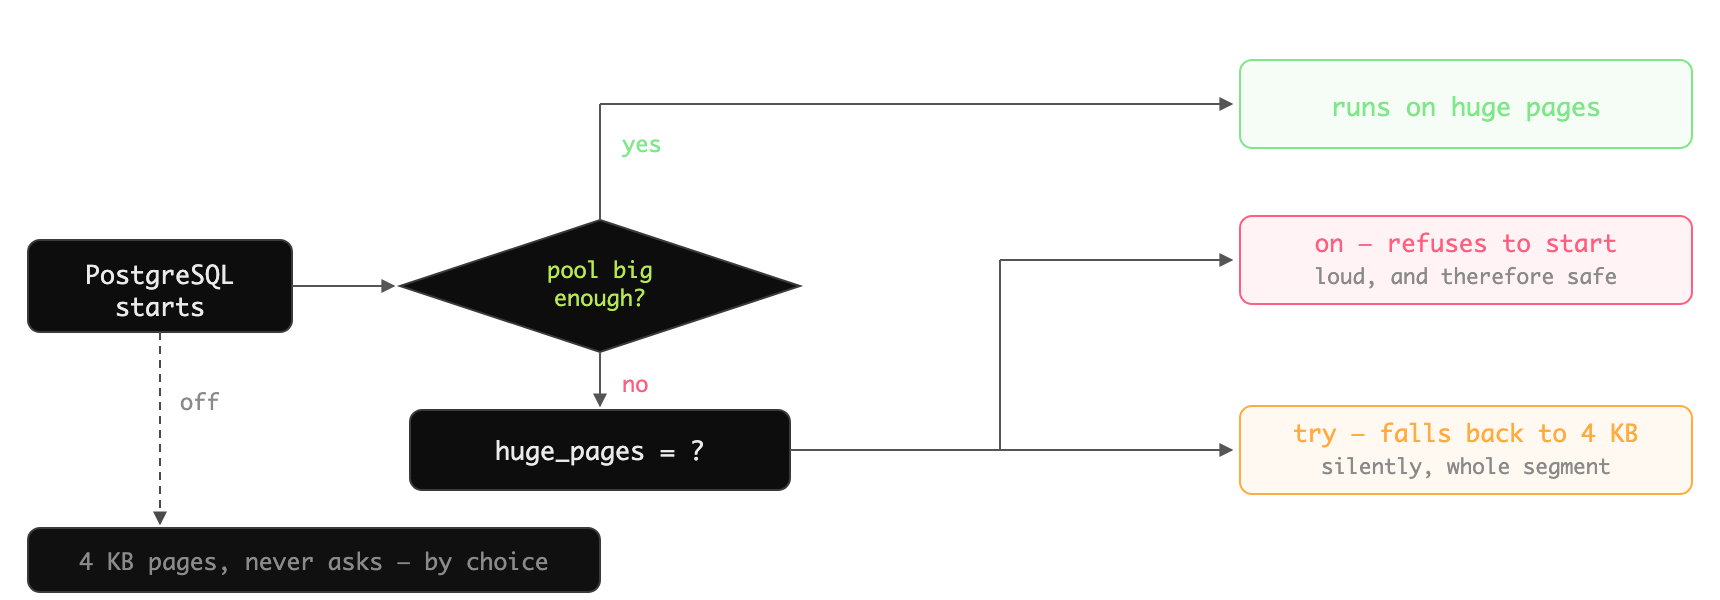
on fails loudly at startup if the reservation is missing. try always starts, but can fall back to 4 KB pages without telling you — so if you use try, monitor separately that huge pages are actually in use.2
Since PostgreSQL 17 that check is a one-liner — huge_pages_status reports what the server actually got, rather than what it asked for:
SHOW huge_pages_status; -- on | off | unknown
Alert on anything other than on.3 On older versions, /proc/meminfo gets you most of the way from the OS side — it shows whether the pool is being used, though not by whom:
grep -E 'HugePages_Total|HugePages_Free|HugePages_Rsvd|Hugetlb' /proc/meminfo
Two ways this goes wrong. If Total is 0, you never reserved a pool at all. If Total is large but Free is the same as Total and Rsvd is 0, the pool exists and PostgreSQL simply did not take it.
Sizing the reservation
PostgreSQL documents the whole procedure, but the short version is this. Since PostgreSQL 15 the server tells you exactly how many huge pages it needs — no guessing from shared_buffers. There are two ways to read it.
On a running server:
SHOW shared_memory_size_in_huge_pages; -- e.g. 16808
On a stopped one:
postgres -D /var/lib/postgresql/data -C shared_memory_size_in_huge_pages
This parameter is computed at startup, so postgres -C can read it only while the server is shut down — against a live instance it fails on the postmaster.pid lock rather than printing a value.
Both read the number off one real server. To see how each setting moves it, you can play with a calculator:
→ How many huge pages does PostgreSQL need? — the sizing calculator
ℹ️ About the calculator. It uses the same formulas as the PostgreSQL source. Against
postgres -Con real 17 and 18 servers the difference is under 0.25 %.
Setting up huge pages in Linux
Take the number from above, add 1–2 %, and round up to something you can read at a glance. The pool is managed through vm.nr_hugepages, and the setting that counts is the one applied at boot, when memory is least fragmented:
echo 'vm.nr_hugepages = 17000' >> /etc/sysctl.conf
sysctl -w applies the same value immediately and is useful for testing on a live machine, but it is the unreliable path: on a fragmented system the kernel hands back fewer pages than requested, without reporting an error. Always read back what you actually got:
sysctl -w vm.nr_hugepages=17000
grep HugePages_Total /proc/meminfo    # must equal 17000 — anything lower is a partial allocation
If it comes back short, memory is already too fragmented to satisfy the request at runtime. Before reaching for a reboot, give the kernel a better chance: stop PostgreSQL, drop the page cache, compact memory, then ask again. With the largest consumer gone and the cache released, the request often goes through:
systemctl stop postgresql
sync; echo 3 > /proc/sys/vm/drop_caches
echo 1 > /proc/sys/vm/compact_memory
sysctl -w vm.nr_hugepages=17000
grep HugePages_Total /proc/meminfo    # check again
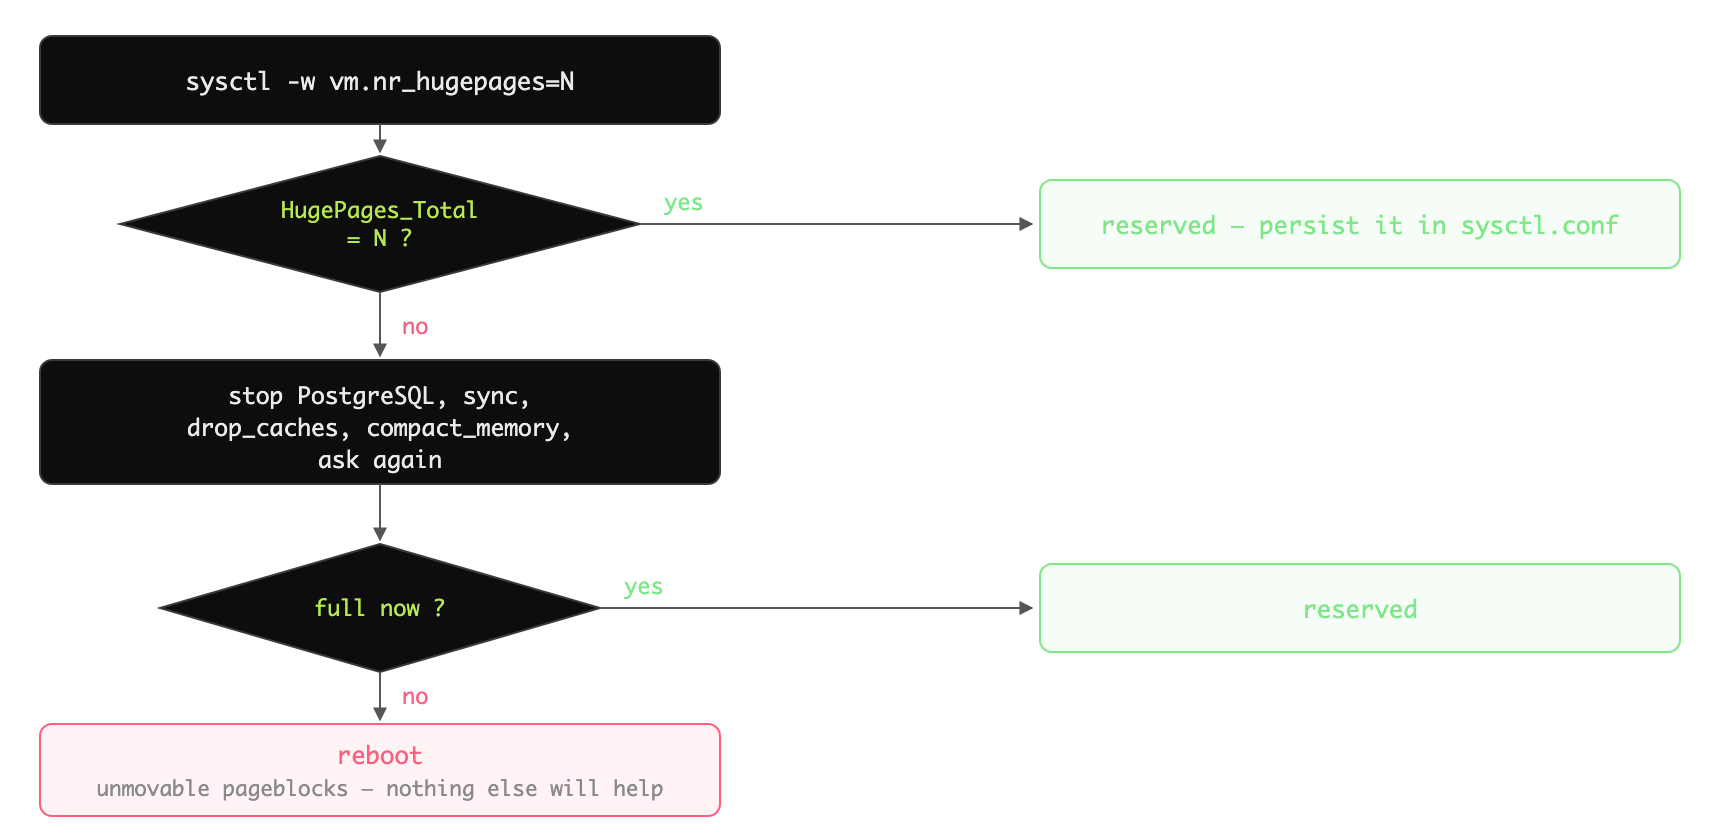
Still short — reboot the machine, and the value you wrote to /etc/sysctl.conf above will be applied early in boot, while memory is still largely unfragmented.
⚠️ On a multi-socket server, check that
vm.zone_reclaim_modeis0— with1the kernel throws away local page cache instead of taking free memory from a neighbouring node, which costs a database far more than the remote access it saves. It has been the kernel default since Linux 3.16, so this is a check for inherited machines and tuning profiles, not something you normally set.
Transparent Huge Pages
THP is a different mechanism and not a substitute for an explicit reservation: it is best-effort, so the kernel gives you huge pages when it can and may take them back later. The usual advice is to turn it off. These are sysfs knobs, not sysctls — /etc/sysctl.conf will not persist them:
cat /sys/kernel/mm/transparent_hugepage/enabled   # current value is the one in brackets
echo never > /sys/kernel/mm/transparent_hugepage/enabled
To make it permanent, add transparent_hugepage=never to the kernel command line.
🧠 About this advice. “Turn off THP” has been repeated in article after article for decades — and now in this one too. I have not tested it on a modern kernel. I think it matters much less today than it did ten years ago. I hope someone tests how THP and PostgreSQL behave on modern kernels.
5. Aside: a pooler may be enough
Note. Everything below assumes a pooler in transaction mode.
ℹ️ An aside, not part of the rollout above. Page-table memory grows with two things: how many backends you run, and how small the pages are. Huge pages fix the second. A pooler fixes the first — with no reboot, no kernel tuning and no reserved memory. One does not replace the other: a pooler cannot make a page table smaller, and huge pages cannot stop your app from opening 600 connections.
pool_size caps backends. 500 clients through a pool of 30 produce 30 backends, not 500 — at 32 GB shared_buffers, roughly 1.9 GB of page tables instead of 31 GB. Growth becomes a function of pool size, not of how many connections your application opens.
Backends stay hot. Server connections are reused far more densely, so each backend’s working set stays warm and its translations stay resident. A server connection also lives on its own, separately from the client connection that used it — so an application that opens and closes connections all the time does not pay a new first touch every time. The same helps after a database restart: if the pool takes the most recently used connection first, only a few backends have to warm up.4
Recycling kills bloated backends. Poolers can close server connections after a set lifetime, and a backend with a large page table dies along with it. This works regardless of application behaviour, which matters for legacy clients that never close connections.5
A pooler reduces the scale of the problem; huge pages reduce the cost per unit. They are orthogonal, and together 30 backends at 128 KB each is not a number worth thinking about.
See also: Effective PgBouncer monitoring using Odarix and AWS RDS Proxy for PostgreSQL.
6. Conclusion
Huge pages are a narrow optimisation with a clear mechanism. They do not make PostgreSQL faster in general — they remove address-translation overhead, and only for shared memory.6 Whether that is worth doing is not a judgement call: measure what your current workload actually spends on page tables, and decide whether that number is large enough to care about.
Rollout checklist
- Measure —
grep '^PageTables' /proc/meminfo. Happy with the number? Stop here. - Disable transparent huge pages.
- Get the requirement —
SHOW shared_memory_size_in_huge_pages;on the running server. - Reserve it at boot in
/etc/sysctl.conf, plus a margin. - Multi-socket box — check
vm.zone_reclaim_mode = 0. - Choose
huge_pages = on, ortrywith an alert. - Restart if needed. Confirm
HugePages_Freedropped andhuge_pages_statusreadson. - Re-measure, compare with step 1.
Notes
-
The ceiling assumes every backend has read all of
shared_buffers; 64 MB is the figure for a fully warmed one. A backend only allocates entries for pages it has actually touched, so its table grows with what it has read over its whole lifetime. The longer it lives, the closer it drifts to the ceiling. ↩ -
With
try, PostgreSQL asks forMAP_HUGETLBand, if that fails, silently retries the mapping without it. The server starts, looks healthy, and runs on 4 KB pages. The common ways to end up there:vm.nr_hugepagesnever set; set but too small aftershared_buffersgrew; or set withsysctl -wand never persisted to/etc/sysctl.conf, so it vanished at the last reboot. ↩ -
huge_pages_statuswas added in PostgreSQL 17 precisely becausetrygave no way to confirm the outcome. A running instance reportsonoroff. The third value,unknown, means the status could not be determined — you get it when the parameter is read withpostgres -Cagainst a stopped server, since nothing has been allocated yet. ↩ -
Pool documentation is inconsistent about naming this. The behaviour that keeps backends cold is the stack-like one — most-recently-used connection reused first, often labelled LIFO or MRU. The queue-like behaviour — FIFO or round-robin — warms every backend. Check what your driver actually does rather than trusting the acronym, and confirm it by comparing
VmPTEacross backends: an even spread means all are hot, a wide spread means only a subset is. ↩ -
Recycling throws away warm page tables along with bloated ones. Too short a lifetime buys a steady stream of re-faults, plus fork cost, plus a cold catalog cache on every new backend. It is a trade between steady-state table size and fault frequency, not a free win. Most poolers also offer an idle-based equivalent, which achieves the same thing driven by idleness rather than age and is usually the cheaper of the two. In PgBouncer these are
server_lifetimeandserver_idle_timeout; other poolers use their own names for the same two ideas. ↩ -
work_mem,maintenance_work_mem, catalog and plan caches are all still backed by 4 KB pages. Huge pages apply to the shared memory segment only. ↩
Tweet